Report Designer
Data Filtering
Filtering data is data selection by some condition. For example, the statistics of visits for the last twenty four hours or sales volume by a definite category, etc. The data are filtered with rows, i.e if a logical operation triggers for a definite value of one field, the values from other fields of this row will be displayed. Besides, you can specify the Expression as filter value. In this case, the result of expression calculation will be a value for a logical condition in a filter.
Due to different version of component using, the image and user guide for Report Designer might have slightly different from the component using in Xin 365.
To Create the Filtering Criteria
1. Double click on DataBand in the report design, choose Filter tab.
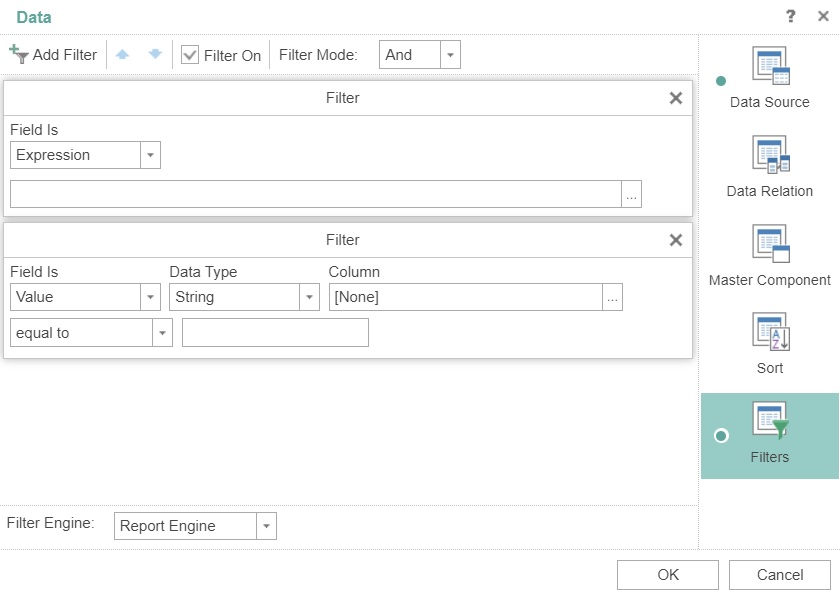
2. Click on Add Filter on the top left, a new row of filtering criteria created. You can add multiple filtering criteria, and sort the filtering criteria by using the up and down arrow button.
3. The Filter On box is used to enable or disable filters.
4. Filter Mode applicable if you define more than 1 filtering criteria.
And - all criteria must be met
Or - meet any criteria
| Column | Description |
|---|---|
| Field Is |
Value - choose a column from the data source to be filtered. Expression - the result of expression calculation will be a value for a logical condition in a filter. |
| Data Type | The type of the column to be filtered, such as string, numeric etc. |
| Column | Choose a column from the data source. |
| Condition | Define how the value comparison to be, such as equal to, containing, beginning with etc. |
| Value | The comparison value. |
Next topic: Watermark
Previous topic: Data Sorting
Need help?
Connect with us
New to Xin 365?
Sign up today