Report Designer
Panels
In this section the basic panels of the designer, such as: Dictionary, Report Tree, Properties will be reviewed. These panels contain different properties, functions and commands to control various components of a report, information fields arranged for notification and hints for a user. These panels can be shown or hidden. In the Ribbon UI showing or hiding panels can be done using the Panels button on the View tab. In the Standard UI showing or hiding panels can be done in theView tab of the Main Menu.
Due to different version of component using, the image and user guide for Report Designer might have slightly different from the component using in Xin 365.
Panel Dictionary
The Dictionary panel shows the connected data available data sources, system variables and functions. Besides, a connection and connecting new data sources can be done in the Dictionary. The picture below shows an example of the Dictionary:
| Group | Description |
|---|---|
ToolBar 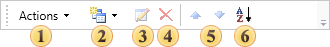
|
The Dictionary ToolBar is a set of tools and commands to work with the Dictionary. 1. The Actions menu is a set of commands to work with vocabulary such as: creating, opening, saving a dictionary, adding, importing and exporting a dictionary to an XML schema, the synchronization of data presented in the dictionary with the data registered in a data store. 2. The New Item menu contains commands for creating new elements: new connection, new data source, new connection, new variable, business objects. 3. The Edit button is used to edit created elements. Pressing the button runs the editor of the element. 4. The Delete button deletes created elements. 5. The Up and Down buttons move the selected item in the hierarchy of a dictionary within a single level of a tree. 6. The Sort Items menu provides the opportunity to choose one of two directions of Sorting: Ascending from A to Z, Descending from Z to A. And also to enable or disable the Auto Sort mode. |
Data Tree 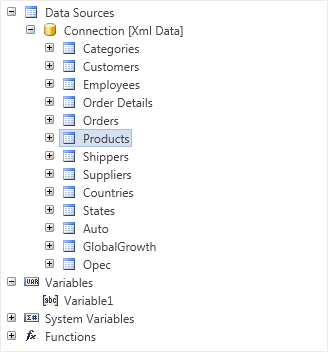
|
The Data Tree represents a list of all data of a dictionary, which are displayed in a tree. |
Description Panel 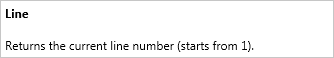
|
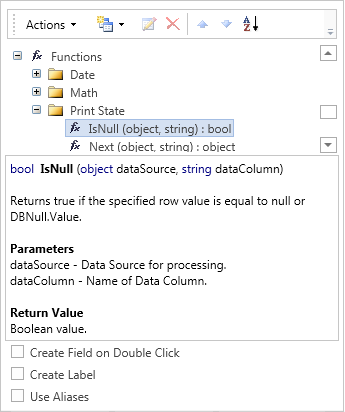
The Description Panel displays a short description of the selected system variable or function. The picture shows an example of the Description Panel with the description of the Line system variable. |
Dictionary Setting Panel 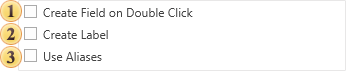
|
The Dictionary Setting Panel is a panel with three options to optimize the work with the dictionary and its contents. 1. The Create Field on Double Click option provides the ability to create a field on the DataBand. Fields are created on the band, that has selected data source by which the fields the double-click in the dictionary is done. 2. The Create Label option attaches the column data header when it is dragged on the report template. 3. The Use Aliases option provides an opportunity to show Aliases of components instead of the Name in the report template. |
Panel Report Tree
The Report Tree panel shows the hierarchy of the report, i.e. represents all the components of the report in the form of a tree. In addition, if an event handler is added to the component, it will also be displayed in the hierarchy of the report. The picture below shows an example of the Report Tree panel:
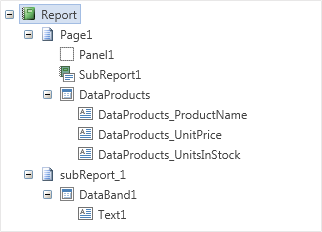
As can be seen on the picture above, hierarchy is represented on the principle of "nesting". The Report Tree panel provides the ability to visually identify the submission of a "component to a component".
Panel Properties
The Properties panel shows all the properties of the selected component, and also its events. The picture below shows the Properties panel, displaying the properties of a component
| Group | Description |
|---|---|
Drop-Down List of Components 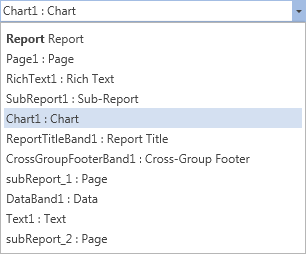
|
The Drop-Down List of Components displays a list of all the components of a report. As can be seen on the picture above, the list is presented in two columns. The first column displays the Name of a component and the second one shows its Type. For example, the string "Chart1: Chart", "Chart1" is a Name, "Chart" this is a Type. If to select a component in this list then, on the Properties panel, properties and events of the selected component will be shown. |
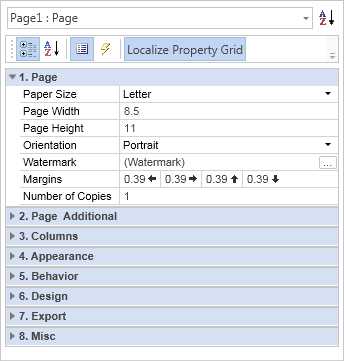
Properties Tab 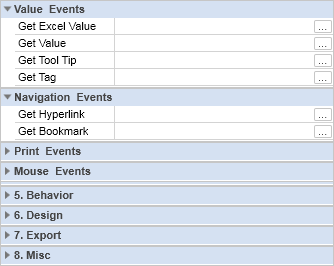
|
The Properties Tab is a table with two columns. The first column shows names of properties. The second column shows values of these properties. The number of rows depends on the number of properties, because one property takes a single row. The picture below presents a table of properties. |